本文最后更新于 1030 天前,其中的信息可能已经有所发展或是发生改变。
kube-prometheus监控Harbor
Harbor官方在Harbor v2.2开始提供对相关指标的采集和使用,所以只要在配置文件开启即可。
部署harbor
省略,参考官方网站或者之前笔记即可
开启metric
解压文件后,修改harbor.yml将metric eneabled改为true
metric:
  enabled: true
  port: 29090 # 默认9090
  path: /metrics
配置kube-prometheus抓取Harbor指标
编辑prometheus-additional.yaml,添加
- job_name: 'harbor-exporter'
  scrape_interval: 20s
  static_configs:
    - targets: ['10.194.24.53:29090']
- job_name: 'harbor-core'
  scrape_interval: 20s
  params:
    #从Harbor core组件中获取度量
    comp: ['core']
  static_configs:
    - targets: ['10.194.24.53:29090']
- job_name: 'harbor-registry'
  scrape_interval: 20s
  params:
    #从Harbor registry组件中获取度量
    comp: ['registry']
  static_configs:
    - targets: ['10.194.24.53:29090']
- job_name: 'harbor-jobservice'
  scrape_interval: 20s
  params:
    # 从Harbor jobservice组件中获取度量
    comp: ['jobservice']
  static_configs:
    - targets: ['10.194.24.53:29090']
执行命令更新配置
上传prometheus-additional.yaml到k8s集群执行以下命令:
kubectl delete secret additional-configs -n monitoring >/dev/null 2>&1
kubectl create secret generic additional-configs --from-file=prometheus-additional.yaml -n monitoring
编辑 prometheus-prometheus.yaml添加额外的抓取参数
additionalScrapeConfigs:
    name: additional-configs
    key: prometheus-additional.yaml
prometheus-prometheus.yaml在 manifests 目录下,执行:kubectl apply -f prometheus-prometheus.yaml
检查prometheus配置是否正常
##检查 prometheus-additional.yaml 是否有语法错误
kubectl exec -it prometheus-k8s-1 -n monitoring -- promtool check config /etc/prometheus/config_out/prometheus.env.yaml
创建harbor-rule.yaml
apiVersion: monitoring.coreos.com/v1
kind: PrometheusRule
metadata:
labels:
prometheus: k8s
role: alert-rules
name: harbor-rules
namespace: monitoring
spec:
groups:
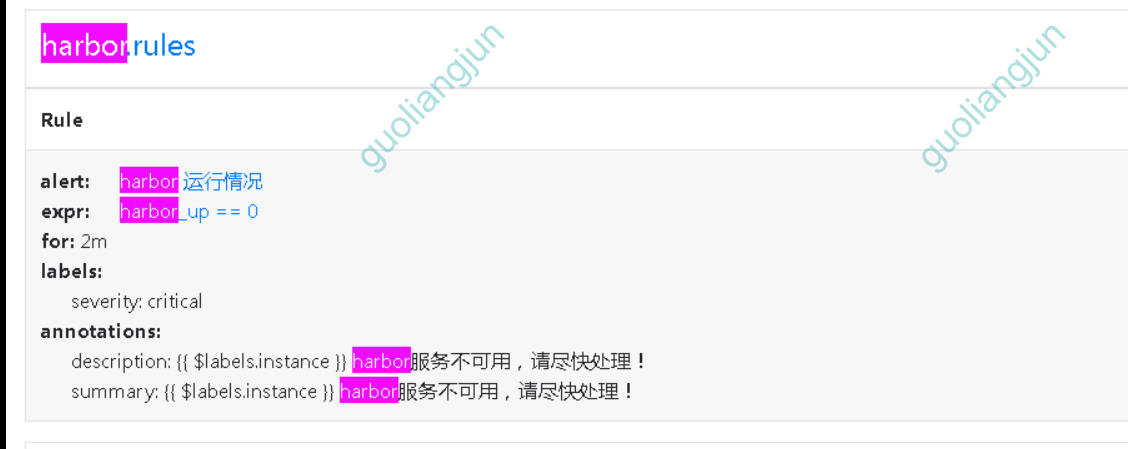
- name: harbor.rules
rules:
- alert: harbor 运行情况
expr: harbor_up == 0
for: 2m
labels:
severity: critical
annotations:
summary: "{{ $labels.instance }} harbor服务不可用,请尽快处理!"
description: "{{ $labels.instance }} harbor服务不可用,请尽快处理!"
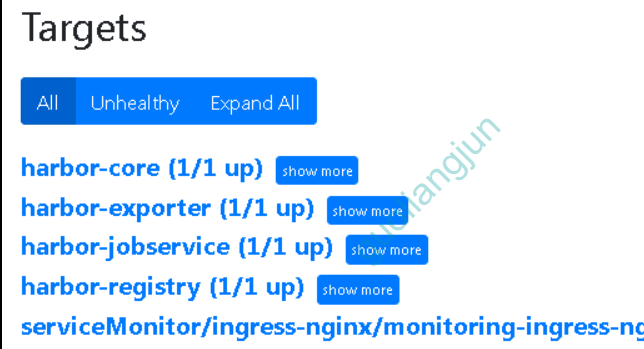
在kube-prometheus中查看harbor Targets和rule
grafana配置harbor监控图表
参考:https://grafana.com/grafana/dashboards/16686-harbor-dashboard/做了自己ip获取的优化,也需要和ndoe-exporter数据配合使用。
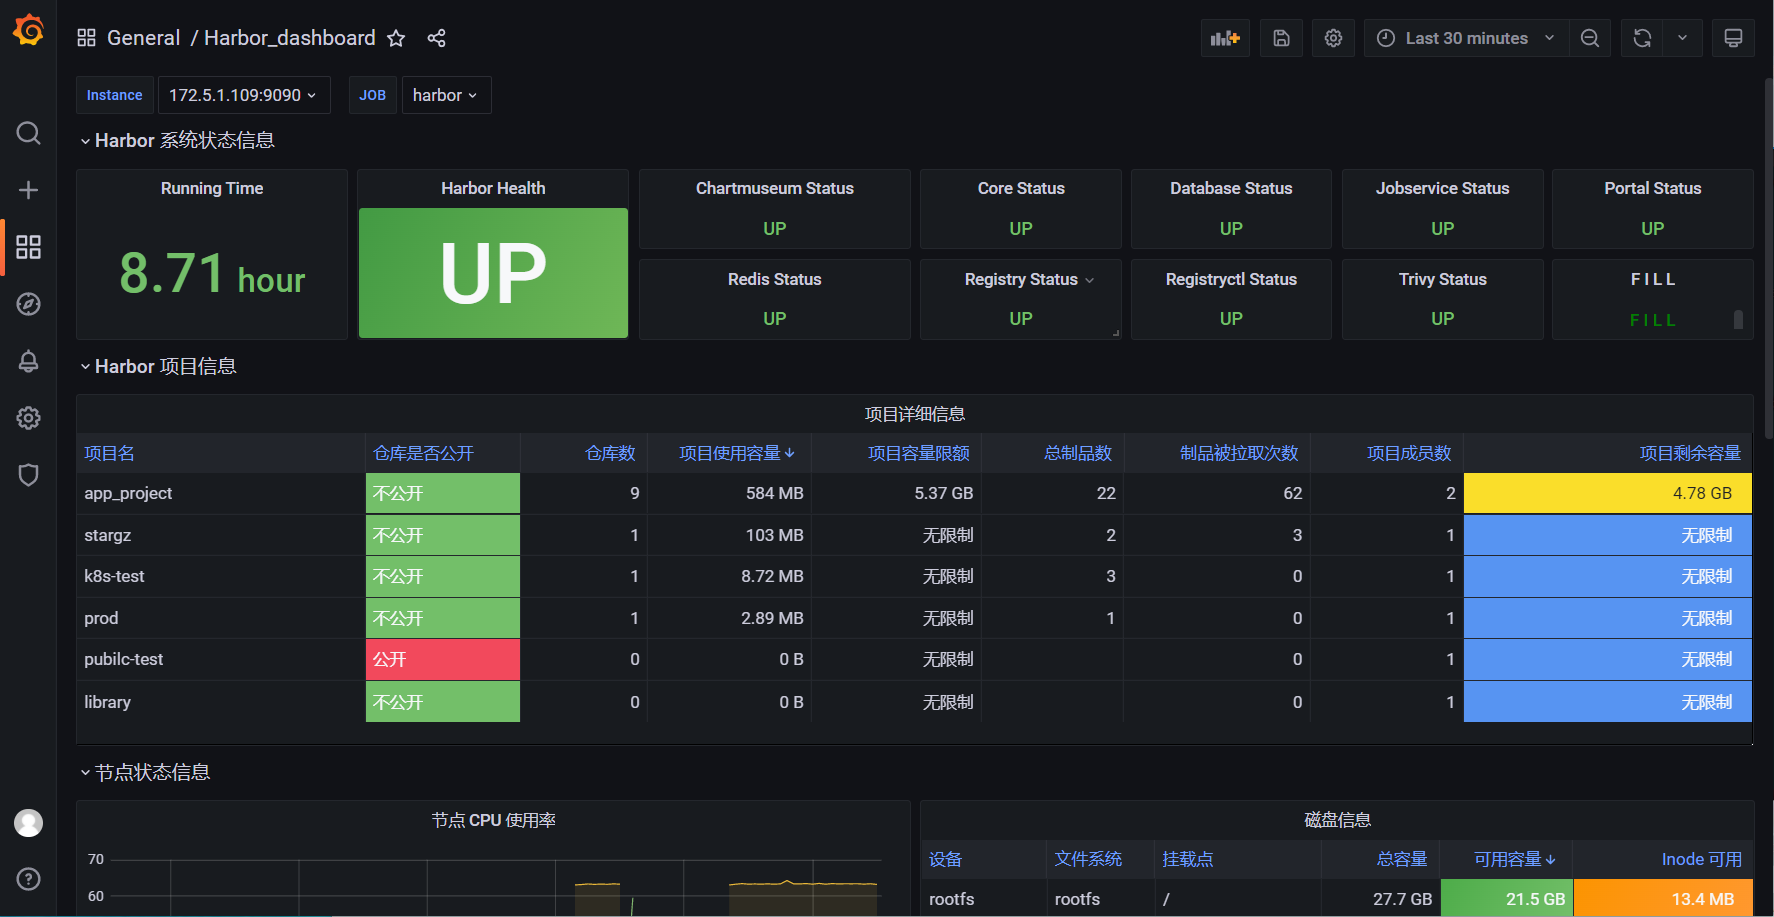
大屏json如下:
{
"annotations": {
"list": [
{
"builtIn": 1,
"datasource": "-- Grafana --",
"enable": true,
"hide": true,
"iconColor": "rgba(0, 211, 255, 1)",
"name": "Annotations & Alerts",
"target": {
"limit": 100,
"matchAny": false,
"tags": [],
"type": "dashboard"
},
"type": "dashboard"
}
]
},
"editable": true,
"gnetId": null,
"graphTooltip": 0,
"id": 51,
"iteration": 1695105410147,
"links": [],
"panels": [
{
"collapsed": false,
"datasource": null,
"gridPos": {
"h": 1,
"w": 24,
"x": 0,
"y": 0
},
"id": 2,
"panels": [],
"title": "Harbor 系统状态信息",
"type": "row"
},
{
"datasource": "prometheus",
"fieldConfig": {
"defaults": {
"color": {
"mode": "thresholds"
},
"mappings": [],
"thresholds": {
"mode": "absolute",
"steps": [
{
"color": "green",
"value": null
}
]
},
"unit": "s"
},
"overrides": []
},
"gridPos": {
"h": 6,
"w": 4,
"x": 0,
"y": 1
},
"id": 4,
"options": {
"colorMode": "background",
"graphMode": "none",
"justifyMode": "auto",
"orientation": "auto",
"reduceOptions": {
"calcs": [
"lastNotNull"
],
"fields": "",
"values": false
},
"text": {},
"textMode": "auto"
},
"pluginVersion": "8.1.1",
"targets": [
{
"exemplar": true,
"expr": "time() - process_start_time_seconds{job=\"$job\", instance=\"$instance\"}",
"format": "time_series",
"interval": "",
"intervalFactor": 1,
"legendFormat": "",
"queryType": "randomWalk",
"refId": "A"
}
],
"title": "Running Time",
"type": "stat"
},
{
"datasource": "prometheus",
"fieldConfig": {
"defaults": {
"color": {
"mode": "thresholds"
},
"mappings": [
{
"options": {
"0": {
"color": "red",
"index": 1,
"text": "DOWN"
},
"1": {
"color": "green",
"index": 0,
"text": "UP"
}
},
"type": "value"
}
],
"thresholds": {
"mode": "absolute",
"steps": [
{
"color": "green",
"value": null
}
]
}
},
"overrides": []
},
"gridPos": {
"h": 6,
"w": 4,
"x": 4,
"y": 1
},
"id": 6,
"options": {
"colorMode": "background",
"graphMode": "none",
"justifyMode": "center",
"orientation": "auto",
"reduceOptions": {
"calcs": [
"lastNotNull"
],
"fields": "",
"values": false
},
"text": {},
"textMode": "auto"
},
"pluginVersion": "8.1.1",
"targets": [
{
"exemplar": true,
"expr": "harbor_health{job='$job',instance='$instance'}",
"interval": "",
"legendFormat": "",
"queryType": "randomWalk",
"refId": "A"
}
],
"title": "Harbor Health",
"type": "stat"
},
{
"datasource": "prometheus",
"fieldConfig": {
"defaults": {
"color": {
"mode": "thresholds"
},
"mappings": [
{
"options": {
"0": {
"color": "red",
"index": 1,
"text": "DOWN"
},
"1": {
"color": "green",
"index": 0,
"text": "UP"
}
},
"type": "value"
}
],
"thresholds": {
"mode": "absolute",
"steps": [
{
"color": "green",
"value": null
},
{
"color": "red",
"value": 80
}
]
}
},
"overrides": []
},
"gridPos": {
"h": 3,
"w": 4,
"x": 8,
"y": 1
},
"id": 8,
"options": {
"colorMode": "background",
"graphMode": "none",
"justifyMode": "auto",
"orientation": "auto",
"reduceOptions": {
"calcs": [
"lastNotNull"
],
"fields": "",
"values": false
},
"text": {},
"textMode": "auto"
},
"pluginVersion": "8.1.1",
"targets": [
{
"exemplar": true,
"expr": "harbor_up{job='$job',instance='$instance',component='core'}",
"hide": false,
"interval": "",
"legendFormat": "",
"refId": "A"
}
],
"title": "Core Status",
"type": "stat"
},
{
"datasource": "prometheus",
"fieldConfig": {
"defaults": {
"color": {
"mode": "thresholds"
},
"mappings": [
{
"options": {
"0": {
"color": "red",
"index": 1,
"text": "DOWN"
},
"1": {
"color": "green",
"index": 0,
"text": "UP"
}
},
"type": "value"
}
],
"thresholds": {
"mode": "absolute",
"steps": [
{
"color": "green",
"value": null
},
{
"color": "red",
"value": 80
}
]
}
},
"overrides": []
},
"gridPos": {
"h": 3,
"w": 4,
"x": 12,
"y": 1
},
"id": 12,
"options": {
"colorMode": "background",
"graphMode": "none",
"justifyMode": "auto",
"orientation": "auto",
"reduceOptions": {
"calcs": [
"lastNotNull"
],
"fields": "",
"values": false
},
"text": {},
"textMode": "auto"
},
"pluginVersion": "8.1.1",
"targets": [
{
"exemplar": true,
"expr": "harbor_up{job='$job',instance='$instance',component='jobservice'}",
"hide": false,
"interval": "",
"legendFormat": "",
"refId": "A"
}
],
"title": "Jobservice Status",
"type": "stat"
},
{
"datasource": "prometheus",
"fieldConfig": {
"defaults": {
"color": {
"mode": "thresholds"
},
"mappings": [
{
"options": {
"0": {
"color": "red",
"index": 1,
"text": "DOWN"
},
"1": {
"color": "green",
"index": 0,
"text": "UP"
}
},
"type": "value"
}
],
"thresholds": {
"mode": "absolute",
"steps": [
{
"color": "green",
"value": null
},
{
"color": "red",
"value": 80
}
]
}
},
"overrides": []
},
"gridPos": {
"h": 3,
"w": 4,
"x": 16,
"y": 1
},
"id": 16,
"options": {
"colorMode": "background",
"graphMode": "none",
"justifyMode": "auto",
"orientation": "auto",
"reduceOptions": {
"calcs": [
"lastNotNull"
],
"fields": "",
"values": false
},
"text": {},
"textMode": "auto"
},
"pluginVersion": "8.1.1",
"targets": [
{
"exemplar": true,
"expr": "harbor_up{job='$job',instance='$instance',component='redis'}",
"hide": false,
"interval": "",
"legendFormat": "",
"refId": "A"
}
],
"title": "Redis Status",
"type": "stat"
},
{
"datasource": "prometheus",
"fieldConfig": {
"defaults": {
"color": {
"mode": "thresholds"
},
"mappings": [
{
"options": {
"0": {
"color": "red",
"index": 1,
"text": "DOWN"
},
"1": {
"color": "green",
"index": 0,
"text": "UP"
}
},
"type": "value"
}
],
"thresholds": {
"mode": "absolute",
"steps": [
{
"color": "green",
"value": null
},
{
"color": "red",
"value": 80
}
]
}
},
"overrides": []
},
"gridPos": {
"h": 3,
"w": 4,
"x": 20,
"y": 1
},
"id": 19,
"options": {
"colorMode": "background",
"graphMode": "none",
"justifyMode": "auto",
"orientation": "auto",
"reduceOptions": {
"calcs": [
"lastNotNull"
],
"fields": "",
"values": false
},
"text": {},
"textMode": "auto"
},
"pluginVersion": "8.1.1",
"targets": [
{
"exemplar": true,
"expr": "harbor_up{job='$job',instance='$instance',component='trivy'}",
"hide": false,
"interval": "",
"legendFormat": "",
"refId": "A"
}
],
"title": "Trivy Status",
"type": "stat"
},
{
"datasource": "prometheus",
"fieldConfig": {
"defaults": {
"color": {
"mode": "thresholds"
},
"mappings": [
{
"options": {
"0": {
"color": "red",
"index": 1,
"text": "DOWN"
},
"1": {
"color": "green",
"index": 0,
"text": "UP"
}
},
"type": "value"
}
],
"thresholds": {
"mode": "absolute",
"steps": [
{
"color": "green",
"value": null
},
{
"color": "red",
"value": 80
}
]
}
},
"overrides": []
},
"gridPos": {
"h": 3,
"w": 4,
"x": 8,
"y": 4
},
"id": 10,
"options": {
"colorMode": "background",
"graphMode": "none",
"justifyMode": "auto",
"orientation": "auto",
"reduceOptions": {
"calcs": [
"lastNotNull"
],
"fields": "",
"values": false
},
"text": {},
"textMode": "auto"
},
"pluginVersion": "8.1.1",
"targets": [
{
"exemplar": true,
"expr": "harbor_up{job='$job',instance='$instance',component='database'}",
"hide": false,
"interval": "",
"legendFormat": "",
"refId": "A"
}
],
"title": "Database Status",
"type": "stat"
},
{
"datasource": "prometheus",
"fieldConfig": {
"defaults": {
"color": {
"mode": "thresholds"
},
"mappings": [
{
"options": {
"0": {
"color": "red",
"index": 1,
"text": "DOWN"
},
"1": {
"color": "green",
"index": 0,
"text": "UP"
}
},
"type": "value"
}
],
"thresholds": {
"mode": "absolute",
"steps": [
{
"color": "green",
"value": null
},
{
"color": "red",
"value": 80
}
]
}
},
"overrides": []
},
"gridPos": {
"h": 3,
"w": 4,
"x": 12,
"y": 4
},
"id": 14,
"options": {
"colorMode": "background",
"graphMode": "none",
"justifyMode": "auto",
"orientation": "auto",
"reduceOptions": {
"calcs": [
"lastNotNull"
],
"fields": "",
"values": false
},
"text": {},
"textMode": "auto"
},
"pluginVersion": "8.1.1",
"targets": [
{
"exemplar": true,
"expr": "harbor_up{job='$job',instance='$instance',component='portal'}",
"hide": false,
"interval": "",
"legendFormat": "",
"refId": "A"
}
],
"title": "Portal Status",
"type": "stat"
},
{
"datasource": "prometheus",
"fieldConfig": {
"defaults": {
"color": {
"mode": "thresholds"
},
"mappings": [
{
"options": {
"0": {
"color": "red",
"index": 1,
"text": "DOWN"
},
"1": {
"color": "green",
"index": 0,
"text": "UP"
}
},
"type": "value"
}
],
"thresholds": {
"mode": "absolute",
"steps": [
{
"color": "green",
"value": null
},
{
"color": "red",
"value": 80
}
]
}
},
"overrides": []
},
"gridPos": {
"h": 3,
"w": 4,
"x": 16,
"y": 4
},
"id": 18,
"options": {
"colorMode": "background",
"graphMode": "none",
"justifyMode": "auto",
"orientation": "auto",
"reduceOptions": {
"calcs": [
"lastNotNull"
],
"fields": "",
"values": false
},
"text": {},
"textMode": "auto"
},
"pluginVersion": "8.1.1",
"targets": [
{
"exemplar": true,
"expr": "harbor_up{job='$job',instance='$instance',component='registry'}",
"hide": false,
"interval": "",
"legendFormat": "",
"refId": "A"
}
],
"title": "Registry Status",
"type": "stat"
},
{
"datasource": "prometheus",
"fieldConfig": {
"defaults": {
"color": {
"mode": "thresholds"
},
"mappings": [
{
"options": {
"0": {
"color": "red",
"index": 1,
"text": "DOWN"
},
"1": {
"color": "green",
"index": 0,
"text": "UP"
}
},
"type": "value"
}
],
"thresholds": {
"mode": "absolute",
"steps": [
{
"color": "green",
"value": null
},
{
"color": "red",
"value": 80
}
]
}
},
"overrides": []
},
"gridPos": {
"h": 3,
"w": 4,
"x": 20,
"y": 4
},
"id": 20,
"options": {
"colorMode": "background",
"graphMode": "none",
"justifyMode": "auto",
"orientation": "auto",
"reduceOptions": {
"calcs": [
"lastNotNull"
],
"fields": "",
"values": false
},
"text": {},
"textMode": "auto"
},
"pluginVersion": "8.1.1",
"targets": [
{
"exemplar": true,
"expr": "harbor_up{job='$job',instance='$instance',component='registryctl'}",
"hide": false,
"interval": "",
"legendFormat": "",
"refId": "A"
}
],
"title": "Registryctl Status",
"type": "stat"
},
{
"collapsed": false,
"datasource": null,
"gridPos": {
"h": 1,
"w": 24,
"x": 0,
"y": 7
},
"id": 22,
"panels": [],
"title": "Harbor 项目信息",
"type": "row"
},
{
"datasource": "prometheus",
"fieldConfig": {
"defaults": {
"color": {
"mode": "thresholds"
},
"custom": {
"align": "auto",
"displayMode": "auto"
},
"mappings": [],
"thresholds": {
"mode": "absolute",
"steps": [
{
"color": "green",
"value": null
},
{
"color": "red",
"value": 80
}
]
}
},
"overrides": [
{
"matcher": {
"id": "byName",
"options": "项目使用容量"
},
"properties": [
{
"id": "unit",
"value": "decbytes"
},
{
"id": "custom.width",
"value": 138
}
]
},
{
"matcher": {
"id": "byName",
"options": "项目容量限额"
},
"properties": [
{
"id": "unit",
"value": "decbytes"
},
{
"id": "mappings",
"value": [
{
"options": {
"-1": {
"index": 0,
"text": "无限制"
}
},
"type": "value"
}
]
},
{
"id": "custom.width",
"value": 143
}
]
},
{
"matcher": {
"id": "byName",
"options": "仓库数"
},
"properties": [
{
"id": "custom.width",
"value": 107
}
]
},
{
"matcher": {
"id": "byName",
"options": "总制品数"
},
"properties": [
{
"id": "custom.width",
"value": 120
}
]
},
{
"matcher": {
"id": "byName",
"options": "制品被拉取次数"
},
"properties": [
{
"id": "custom.width",
"value": 157
}
]
},
{
"matcher": {
"id": "byName",
"options": "仓库是否开放"
},
"properties": [
{
"id": "custom.width",
"value": 131
}
]
},
{
"matcher": {
"id": "byName",
"options": "项目成员数"
},
"properties": [
{
"id": "custom.width",
"value": 129
}
]
},
{
"matcher": {
"id": "byName",
"options": "仓库是否开放"
},
"properties": [
{
"id": "mappings",
"value": [
{
"options": {
"false": {
"color": "green",
"index": 0,
"text": "不公开"
},
"true": {
"color": "red",
"index": 1,
"text": "公开"
}
},
"type": "value"
}
]
},
{
"id": "custom.displayMode",
"value": "color-background-solid"
}
]
},
{
"matcher": {
"id": "byName",
"options": "项目剩余容量"
},
"properties": [
{
"id": "mappings",
"value": [
{
"options": {
"from": -1e+25,
"result": {
"color": "blue",
"index": 0,
"text": "无限制"
},
"to": -1
},
"type": "range"
}
]
},
{
"id": "custom.displayMode",
"value": "color-background-solid"
},
{
"id": "thresholds",
"value": {
"mode": "absolute",
"steps": [
{
"color": "red",
"value": null
},
{
"color": "red",
"value": 0
},
{
"color": "yellow",
"value": 3221225472
},
{
"color": "green",
"value": 5368709120
}
]
}
},
{
"id": "unit",
"value": "decbytes"
}
]
}
]
},
"gridPos": {
"h": 8,
"w": 24,
"x": 0,
"y": 8
},
"id": 24,
"options": {
"footer": {
"fields": "",
"reducer": [
"sum"
],
"show": false
},
"frameIndex": 0,
"showHeader": true,
"sortBy": [
{
"desc": true,
"displayName": "项目使用容量"
}
]
},
"pluginVersion": "8.1.1",
"targets": [
{
"alias": "",
"bucketAggs": [
{
"field": "@timestamp",
"id": "2",
"settings": {
"interval": "auto"
},
"type": "date_histogram"
}
],
"exemplar": true,
"expr": "harbor_project_repo_total{job=\"$job\", instance=\"$instance\"}",
"format": "table",
"instant": false,
"interval": "",
"legendFormat": "",
"metrics": [
{
"id": "1",
"type": "count"
}
],
"query": "",
"refId": "A",
"timeField": "@timestamp"
},
{
"exemplar": true,
"expr": "harbor_project_quota_usage_byte{job=\"$job\", instance=\"$instance\"}",
"format": "table",
"hide": false,
"instant": false,
"interval": "",
"legendFormat": "",
"refId": "B"
},
{
"exemplar": true,
"expr": "harbor_project_quota_byte{job=\"$job\", instance=\"$instance\"}",
"format": "table",
"hide": false,
"interval": "",
"legendFormat": "",
"refId": "C"
},
{
"exemplar": true,
"expr": "harbor_project_member_total{job=\"$job\", instance=\"$instance\"}",
"format": "table",
"hide": false,
"interval": "",
"legendFormat": "",
"refId": "D"
},
{
"exemplar": true,
"expr": "harbor_project_artifact_total{job=\"$job\", instance=\"$instance\"}",
"hide": false,
"interval": "",
"legendFormat": "",
"refId": "E"
},
{
"exemplar": true,
"expr": "harbor_artifact_pulled{job=\"$job\", instance=\"$instance\"}",
"format": "table",
"hide": false,
"interval": "",
"legendFormat": "",
"refId": "F"
},
{
"exemplar": true,
"expr": "harbor_project_quota_byte{job=\"$job\", instance=\"$instance\"} - harbor_project_quota_usage_byte{job=\"$job\", instance=\"$instance\"}",
"format": "table",
"hide": false,
"interval": "",
"legendFormat": "",
"refId": "G"
}
],
"title": "项目详细信息",
"transformations": [
{
"id": "filterFieldsByName",
"options": {
"include": {
"names": [
"project_name",
"public",
"Value #A",
"Value #B",
"Value #C",
"Value #D",
"Value #G",
"Value #F"
]
}
}
},
{
"id": "seriesToColumns",
"options": {
"byField": "project_name"
}
},
{
"id": "organize",
"options": {
"excludeByName": {
"public": false,
"public 2": true
},
"indexByName": {
"Value #A": 2,
"Value #B": 3,
"Value #C": 4,
"Value #D": 6,
"Value #F": 5,
"Value #G": 7,
"project_name": 0,
"public": 1
},
"renameByName": {
"Value #A": "仓库数",
"Value #B": "项目使用容量",
"Value #C": "项目容量限额",
"Value #D": "项目成员数",
"Value #E": "总制品数",
"Value #F": "制品被拉取次数",
"Value #G": "项目剩余容量",
"project_name": "项目名",
"public": "仓库是否开放",
"public 1": "仓库是否公开"
}
}
}
],
"type": "table"
},
{
"collapsed": false,
"datasource": null,
"gridPos": {
"h": 1,
"w": 24,
"x": 0,
"y": 16
},
"id": 26,
"panels": [],
"title": "节点状态信息",
"type": "row"
},
{
"aliasColors": {},
"bars": false,
"dashLength": 10,
"dashes": false,
"datasource": "prometheus",
"fill": 1,
"fillGradient": 0,
"gridPos": {
"h": 10,
"w": 12,
"x": 0,
"y": 17
},
"hiddenSeries": false,
"id": 28,
"legend": {
"alignAsTable": true,
"avg": true,
"current": true,
"max": true,
"min": false,
"rightSide": false,
"show": true,
"total": false,
"values": true
},
"lines": true,
"linewidth": 1,
"nullPointMode": "null",
"options": {
"alertThreshold": true
},
"percentage": false,
"pluginVersion": "8.1.1",
"pointradius": 2,
"points": false,
"renderer": "flot",
"seriesOverrides": [],
"spaceLength": 10,
"stack": false,
"steppedLine": false,
"targets": [
{
"alias": "",
"bucketAggs": [
{
"field": "@timestamp",
"id": "2",
"settings": {
"interval": "auto"
},
"type": "date_histogram"
}
],
"exemplar": false,
"expr": "100 - (avg(rate(node_cpu_seconds_total{mode=\"idle\", instance=~\"$ip.*\"}[5m])) by (instance) * 100)",
"format": "time_series",
"hide": false,
"instant": false,
"interval": "",
"legendFormat": "CPU",
"metrics": [
{
"id": "1",
"type": "count"
}
],
"query": "",
"refId": "A",
"timeField": "@timestamp"
},
{
"exemplar": false,
"expr": "(node_memory_MemTotal_bytes{instance=~\"$ip.*\"} - node_memory_MemAvailable_bytes{instance=~\"$ip.*\"}) / node_memory_MemTotal_bytes{instance=~\"$ip.*\"} * 100",
"format": "time_series",
"hide": false,
"instant": false,
"interval": "",
"legendFormat": "内存",
"refId": "B"
}
],
"thresholds": [],
"timeFrom": null,
"timeRegions": [],
"timeShift": null,
"title": "节点 CPU 使用率",
"tooltip": {
"shared": true,
"sort": 0,
"value_type": "individual"
},
"transformations": [],
"type": "graph",
"xaxis": {
"buckets": null,
"mode": "time",
"name": null,
"show": true,
"values": []
},
"yaxes": [
{
"$$hashKey": "object:434",
"format": "short",
"logBase": 1,
"show": true
},
{
"$$hashKey": "object:435",
"format": "short",
"logBase": 1,
"show": true
}
],
"yaxis": {
"align": false
}
},
{
"datasource": "prometheus",
"fieldConfig": {
"defaults": {
"color": {
"mode": "thresholds"
},
"custom": {
"align": "auto",
"displayMode": "auto"
},
"mappings": [],
"thresholds": {
"mode": "absolute",
"steps": [
{
"color": "green",
"value": null
},
{
"color": "red",
"value": 80
}
]
}
},
"overrides": [
{
"matcher": {
"id": "byName",
"options": "总容量"
},
"properties": [
{
"id": "unit",
"value": "decbytes"
},
{
"id": "custom.width",
"value": 100
}
]
},
{
"matcher": {
"id": "byName",
"options": "device"
},
"properties": [
{
"id": "custom.width",
"value": 165
}
]
},
{
"matcher": {
"id": "byName",
"options": "mountpoint"
},
"properties": [
{
"id": "custom.width",
"value": 110
}
]
},
{
"matcher": {
"id": "byName",
"options": "文件系统"
},
"properties": [
{
"id": "custom.width",
"value": 91
}
]
},
{
"matcher": {
"id": "byName",
"options": "挂载点"
},
"properties": [
{
"id": "custom.width",
"value": 140
}
]
},
{
"matcher": {
"id": "byName",
"options": "设备"
},
"properties": [
{
"id": "custom.width",
"value": 106
}
]
},
{
"matcher": {
"id": "byName",
"options": "可用容量"
},
"properties": [
{
"id": "custom.width",
"value": 112
},
{
"id": "unit",
"value": "decbytes"
},
{
"id": "thresholds",
"value": {
"mode": "absolute",
"steps": [
{
"color": "red",
"value": null
},
{
"color": "orange",
"value": 10737418240
},
{
"color": "green",
"value": 21474836480
}
]
}
},
{
"id": "custom.displayMode",
"value": "color-background"
}
]
},
{
"matcher": {
"id": "byName",
"options": "Inode 可用"
},
"properties": [
{
"id": "custom.displayMode",
"value": "color-background"
},
{
"id": "thresholds",
"value": {
"mode": "absolute",
"steps": [
{
"color": "red",
"value": null
},
{
"color": "orange",
"value": 1000000
},
{
"color": "green",
"value": 100000000
}
]
}
},
{
"id": "custom.minWidth",
"value": 100
},
{
"id": "unit",
"value": "decbytes"
}
]
}
]
},
"gridPos": {
"h": 10,
"w": 12,
"x": 12,
"y": 17
},
"id": 30,
"options": {
"footer": {
"fields": "",
"reducer": [
"sum"
],
"show": false
},
"showHeader": true,
"sortBy": [
{
"desc": true,
"displayName": "可用容量"
}
]
},
"pluginVersion": "8.1.1",
"targets": [
{
"alias": "",
"bucketAggs": [
{
"field": "@timestamp",
"id": "2",
"settings": {
"interval": "auto"
},
"type": "date_histogram"
}
],
"exemplar": true,
"expr": "node_filesystem_size_bytes{instance=~\"$ip.*\"}",
"format": "table",
"interval": "",
"legendFormat": "",
"metrics": [
{
"id": "1",
"type": "count"
}
],
"query": "",
"refId": "A",
"timeField": "@timestamp"
},
{
"exemplar": true,
"expr": "node_filesystem_free_bytes{instance=~\"$ip.*\"}",
"format": "table",
"hide": false,
"interval": "",
"legendFormat": "",
"refId": "B"
},
{
"exemplar": true,
"expr": "node_filesystem_files_free{instance=~\"$ip.*\"}",
"format": "table",
"hide": false,
"interval": "",
"legendFormat": "",
"refId": "C"
}
],
"title": "磁盘信息",
"transformations": [
{
"id": "seriesToColumns",
"options": {
"byField": "device"
}
},
{
"id": "filterFieldsByName",
"options": {
"include": {
"names": [
"device",
"fstype 1",
"Value #A",
"Value #B",
"Value #C",
"mountpoint 1"
]
}
}
},
{
"id": "organize",
"options": {
"excludeByName": {},
"indexByName": {},
"renameByName": {
"Value": "总容量",
"Value #A": "总容量",
"Value #B": "可用容量",
"Value #C": "Inode 可用",
"device": "设备",
"fstype 1": "文件系统",
"mountpoint 1": "挂载点"
}
}
}
],
"type": "table"
},
{
"collapsed": false,
"datasource": null,
"gridPos": {
"h": 1,
"w": 24,
"x": 0,
"y": 27
},
"id": 32,
"panels": [],
"title": "Harbor 任务状态信息",
"type": "row"
},
{
"aliasColors": {},
"bars": false,
"dashLength": 10,
"dashes": false,
"datasource": "prometheus",
"fill": 1,
"fillGradient": 0,
"gridPos": {
"h": 8,
"w": 12,
"x": 0,
"y": 28
},
"hiddenSeries": false,
"id": 34,
"legend": {
"avg": false,
"current": false,
"max": false,
"min": false,
"show": false,
"total": false,
"values": false
},
"lines": true,
"linewidth": 1,
"nullPointMode": "null",
"options": {
"alertThreshold": true
},
"percentage": false,
"pluginVersion": "8.1.1",
"pointradius": 2,
"points": false,
"renderer": "flot",
"seriesOverrides": [],
"spaceLength": 10,
"stack": false,
"steppedLine": false,
"targets": [
{
"exemplar": true,
"expr": "process_cpu_seconds_total{job=\"$job\", instance=\"$instance\"}",
"format": "time_series",
"instant": false,
"interval": "",
"legendFormat": "累计 CPU 使用时间",
"queryType": "randomWalk",
"refId": "A"
}
],
"thresholds": [],
"timeFrom": null,
"timeRegions": [],
"timeShift": null,
"title": "累计 CPU 使用时间",
"tooltip": {
"shared": true,
"sort": 0,
"value_type": "individual"
},
"transformations": [],
"type": "graph",
"xaxis": {
"buckets": null,
"mode": "time",
"name": null,
"show": true,
"values": []
},
"yaxes": [
{
"$$hashKey": "object:1108",
"format": "short",
"logBase": 1,
"show": true
},
{
"$$hashKey": "object:1109",
"format": "short",
"logBase": 1,
"show": true
}
],
"yaxis": {
"align": false
}
},
{
"aliasColors": {},
"bars": false,
"dashLength": 10,
"dashes": false,
"datasource": "prometheus",
"fill": 1,
"fillGradient": 0,
"gridPos": {
"h": 8,
"w": 12,
"x": 12,
"y": 28
},
"hiddenSeries": false,
"id": 36,
"legend": {
"avg": false,
"current": false,
"max": false,
"min": false,
"show": false,
"total": false,
"values": false
},
"lines": true,
"linewidth": 1,
"nullPointMode": "null",
"options": {
"alertThreshold": true
},
"percentage": false,
"pluginVersion": "8.1.1",
"pointradius": 2,
"points": false,
"renderer": "flot",
"seriesOverrides": [],
"spaceLength": 10,
"stack": false,
"steppedLine": false,
"targets": [
{
"alias": "",
"bucketAggs": [
{
"field": "@timestamp",
"id": "2",
"settings": {
"interval": "auto"
},
"type": "date_histogram"
}
],
"exemplar": true,
"expr": "process_resident_memory_bytes{job=\"$job\", instance=\"$instance\"} + process_virtual_memory_bytes{job=\"$job\", instance=\"$instance\"}",
"format": "time_series",
"interval": "",
"legendFormat": "常驻内存",
"metrics": [
{
"id": "1",
"type": "count"
}
],
"query": "",
"refId": "A",
"timeField": "@timestamp"
}
],
"thresholds": [],
"timeFrom": null,
"timeRegions": [],
"timeShift": null,
"title": "内存使用",
"tooltip": {
"shared": true,
"sort": 0,
"value_type": "individual"
},
"transformations": [],
"type": "graph",
"xaxis": {
"buckets": null,
"mode": "time",
"name": null,
"show": true,
"values": []
},
"yaxes": [
{
"$$hashKey": "object:1194",
"format": "short",
"logBase": 1,
"show": true
},
{
"$$hashKey": "object:1195",
"format": "short",
"logBase": 1,
"show": true
}
],
"yaxis": {
"align": false
}
},
{
"aliasColors": {},
"bars": false,
"dashLength": 10,
"dashes": false,
"datasource": "prometheus",
"fill": 1,
"fillGradient": 0,
"gridPos": {
"h": 8,
"w": 12,
"x": 0,
"y": 36
},
"hiddenSeries": false,
"id": 38,
"legend": {
"alignAsTable": true,
"avg": true,
"current": true,
"max": false,
"min": false,
"rightSide": true,
"show": true,
"total": false,
"values": true
},
"lines": true,
"linewidth": 1,
"nullPointMode": "null",
"options": {
"alertThreshold": true
},
"percentage": false,
"pluginVersion": "8.1.1",
"pointradius": 2,
"points": false,
"renderer": "flot",
"seriesOverrides": [],
"spaceLength": 10,
"stack": false,
"steppedLine": false,
"targets": [
{
"alias": "",
"bucketAggs": [
{
"field": "@timestamp",
"id": "2",
"settings": {
"interval": "auto"
},
"type": "date_histogram"
}
],
"exemplar": true,
"expr": "harbor_task_queue_latency{job=\"$job\", instance=\"$instance\"}",
"interval": "",
"legendFormat": "{{type}}_latency",
"metrics": [
{
"id": "1",
"type": "count"
}
],
"query": "",
"refId": "A",
"timeField": "@timestamp"
},
{
"hide": false,
"refId": "B"
}
],
"thresholds": [],
"timeFrom": null,
"timeRegions": [],
"timeShift": null,
"title": "任务等待时间",
"tooltip": {
"shared": true,
"sort": 0,
"value_type": "individual"
},
"type": "graph",
"xaxis": {
"buckets": null,
"mode": "time",
"name": null,
"show": true,
"values": []
},
"yaxes": [
{
"$$hashKey": "object:324",
"format": "short",
"logBase": 1,
"min": "0",
"show": true
},
{
"$$hashKey": "object:325",
"format": "short",
"logBase": 1,
"show": true
}
],
"yaxis": {
"align": false
}
},
{
"aliasColors": {},
"bars": false,
"dashLength": 10,
"dashes": false,
"datasource": "prometheus",
"fill": 1,
"fillGradient": 0,
"gridPos": {
"h": 8,
"w": 12,
"x": 12,
"y": 36
},
"hiddenSeries": false,
"id": 40,
"legend": {
"alignAsTable": true,
"avg": true,
"current": true,
"hideEmpty": false,
"hideZero": false,
"max": false,
"min": false,
"rightSide": true,
"show": true,
"total": false,
"values": true
},
"lines": true,
"linewidth": 1,
"nullPointMode": "null",
"options": {
"alertThreshold": true
},
"percentage": false,
"pluginVersion": "8.1.1",
"pointradius": 2,
"points": false,
"renderer": "flot",
"seriesOverrides": [],
"spaceLength": 10,
"stack": false,
"steppedLine": false,
"targets": [
{
"alias": "",
"bucketAggs": [
{
"field": "@timestamp",
"id": "2",
"settings": {
"interval": "auto"
},
"type": "date_histogram"
}
],
"exemplar": true,
"expr": "harbor_task_scheduled_total{job=\"$job\", instance=\"$instance\"}",
"interval": "",
"legendFormat": "scheduled_total",
"metrics": [
{
"id": "1",
"type": "count"
}
],
"query": "",
"queryType": "randomWalk",
"refId": "A",
"timeField": "@timestamp"
},
{
"exemplar": true,
"expr": "harbor_task_queue_size{instance=\"$instance\", job=\"$job\"}",
"hide": false,
"interval": "",
"legendFormat": "{{type}}_total",
"refId": "B"
}
],
"thresholds": [],
"timeFrom": null,
"timeRegions": [],
"timeShift": null,
"title": "任务队列",
"tooltip": {
"shared": true,
"sort": 0,
"value_type": "individual"
},
"type": "graph",
"xaxis": {
"buckets": null,
"mode": "time",
"name": null,
"show": true,
"values": []
},
"yaxes": [
{
"$$hashKey": "object:59",
"format": "short",
"logBase": 1,
"min": "0",
"show": true
},
{
"$$hashKey": "object:60",
"format": "short",
"logBase": 1,
"show": true
}
],
"yaxis": {
"align": false
}
}
],
"refresh": "30m",
"schemaVersion": 30,
"style": "dark",
"tags": [],
"templating": {
"list": [
{
"allValue": null,
"current": {
"selected": false,
"text": "10.194.24.53:29090",
"value": "10.194.24.53:29090"
},
"datasource": "prometheus",
"definition": "label_values(harbor_health{job=\"$job\"}, instance)",
"description": null,
"error": null,
"hide": 0,
"includeAll": false,
"label": "Instance",
"multi": false,
"name": "instance",
"options": [],
"query": {
"query": "label_values(harbor_health{job=\"$job\"}, instance)",
"refId": "StandardVariableQuery"
},
"refresh": 1,
"regex": "",
"skipUrlSync": false,
"sort": 0,
"type": "query"
},
{
"allValue": null,
"current": {
"selected": false,
"text": "harbor-exporter",
"value": "harbor-exporter"
},
"datasource": "prometheus",
"definition": "label_values(harbor_health{}, job)",
"description": "",
"error": null,
"hide": 0,
"includeAll": false,
"label": "JOB",
"multi": false,
"name": "job",
"options": [],
"query": {
"query": "label_values(harbor_health{}, job)",
"refId": "StandardVariableQuery"
},
"refresh": 1,
"regex": "",
"skipUrlSync": false,
"sort": 0,
"type": "query"
},
{
"allValue": null,
"current": {
"selected": false,
"text": "10.194.24.53",
"value": "10.194.24.53"
},
"datasource": "prometheus",
"definition": "label_values(harbor_health{job=\"$job\", instance=\"$instance\"}, instance)",
"description": null,
"error": null,
"hide": 0,
"includeAll": false,
"label": "iP",
"multi": false,
"name": "ip",
"options": [],
"query": {
"query": "label_values(harbor_health{job=\"$job\", instance=\"$instance\"}, instance)",
"refId": "StandardVariableQuery"
},
"refresh": 1,
"regex": "/(\\d+\\.\\d+\\.\\d+\\.\\d+)/",
"skipUrlSync": false,
"sort": 0,
"type": "query"
}
]
},
"time": {
"from": "now-3h",
"to": "now"
},
"timepicker": {},
"timezone": "",
"title": "harbor-dashboard",
"uid": "cJCys8iSk",
"version": 5
}