本文最后更新于 967 天前,其中的信息可能已经有所发展或是发生改变。
kube-prometheus 监控ElasticSearch步骤
此方法既可以监控集群内的ElasticSearch,也可以监控集群外的ElasticSearch,原理和node-exporter一样
操作步骤
创建es-exporter
es-exporter.yaml
apiVersion: apps/v1
kind: Deployment
metadata:
  name: es-exporter
  namespace: logging
spec:
  replicas: 1
  revisionHistoryLimit: 2
  strategy:
    rollingUpdate:
      maxSurge: 1
      maxUnavailable: 0
    type: RollingUpdate
  selector:
    matchLabels:
      app: es-exporter
  template:
    metadata:
      labels:
        app: es-exporter
    spec:

      imagePullSecrets:
        - name: hub
      containers:
        # 参考 https://github.com/prometheus-community/elasticsearch_exporter
        - command:
            - /bin/elasticsearch_exporter
            - --es.all
            - --es.timeout=10s
            - --es.uri=http://username:passwd@elk-elasticsearch:9200
          env:
            - name: TZ
              value: Asia/Shanghai

          image: 10.194.24.53/k8s-component/prometheuscommunity/elasticsearch-exporter:v1.6.0
          securityContext:
            capabilities:
              drop:
                - SETPCAP
                - MKNOD
                - AUDIT_WRITE
                - CHOWN
                - NET_RAW
                - DAC_OVERRIDE
                - FOWNER
                - FSETID
                - KILL
                - SETGID
                - SETUID
                - NET_BIND_SERVICE
                - SYS_CHROOT
                - SETFCAP
            readOnlyRootFilesystem: true
          livenessProbe:
            httpGet:
              path: /healthz
              port: 9114
            initialDelaySeconds: 30
            timeoutSeconds: 10
          name: es-exporter
          ports:
            - containerPort: 9114
              name: http
          readinessProbe:
            httpGet:
              path: /healthz
              port: 9114
            initialDelaySeconds: 10
            timeoutSeconds: 10
          resources:
            limits:
              cpu: 100m
              memory: 128Mi
            requests:
              cpu: 25m
              memory: 64Mi
          volumeMounts:
            - mountPath: /etc/localtime
              name: localtime
      restartPolicy: Always
      securityContext:
        runAsNonRoot: true
        runAsGroup: 10000
        runAsUser: 10000
        fsGroup: 10000
      volumes:
        - name: localtime
          hostPath:
            path: /etc/localtime
es-exporter-svc.yaml
apiVersion: v1
kind: Service
metadata:
  labels:
    app: es-exporter
  name: es-exporter-svc
  namespace: logging
spec:
  ports:
    - name: http-metrics
      port: 9114
      protocol: TCP
      targetPort: 9114
  type: ClusterIP
  selector:
    app: es-exporter
创建servicemonitor的crd对象
apiVersion: monitoring.coreos.com/v1
kind: ServiceMonitor
metadata:
  labels:
    app: es-exporter
  name: es-exporter-sm
  namespace: logging
spec:
  endpoints:
    - bearerTokenFile: /var/run/secrets/kubernetes.io/serviceaccount/token
      port: http-metrics
      interval: 30s
  jobLabel: es-exporter
  namespaceSelector:
    matchNames:
      - logging
  selector:
    matchLabels:
      app: es-exporter
查看target
prometheus自动发现了es-exporter

登录grafana,导入模板
参考:https://grafana.com/grafana/dashboards/2322
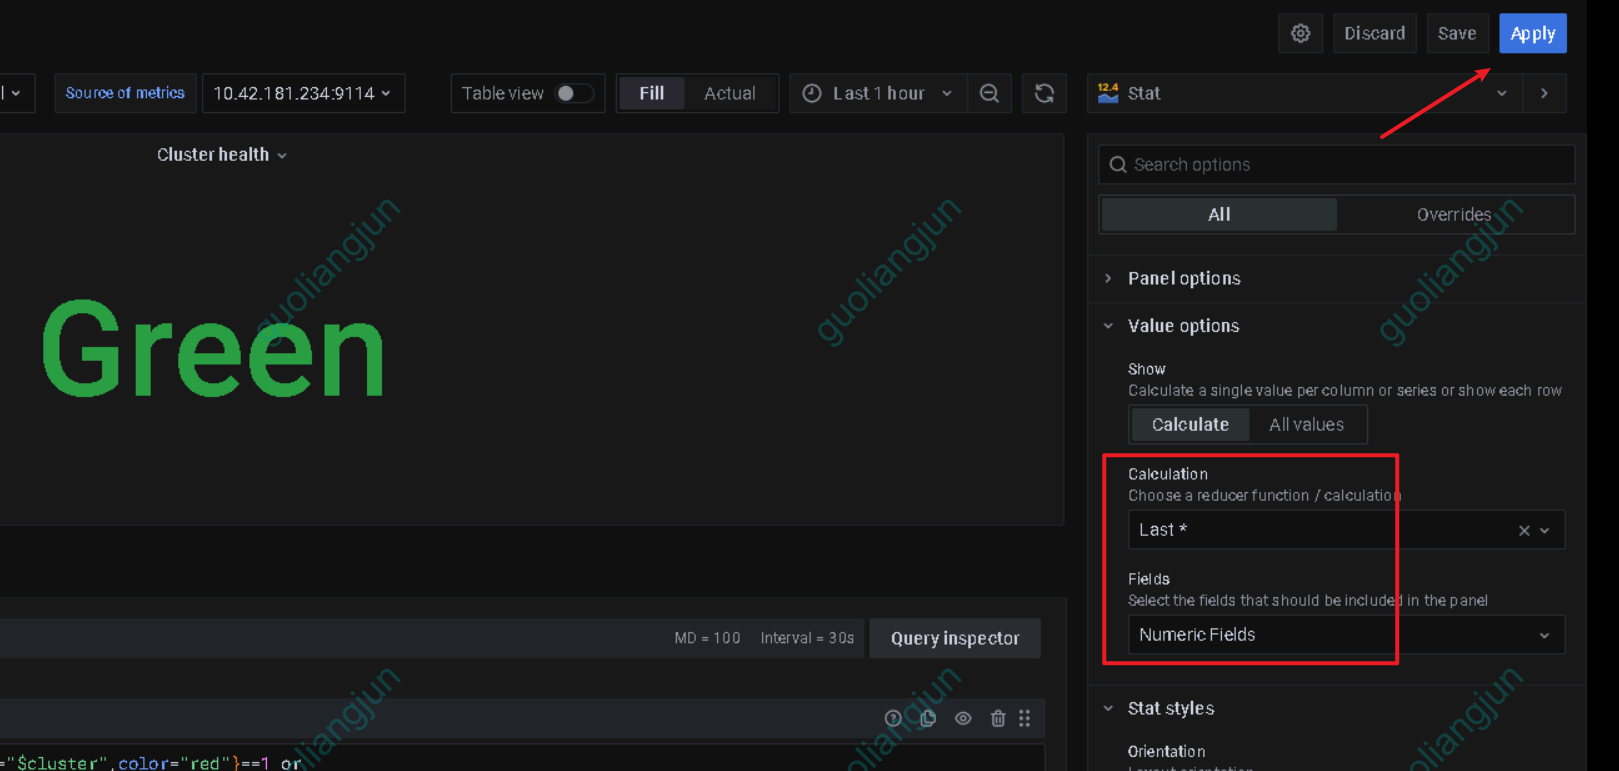
解决Cluster health监控显示为N/A 问题
选中cluster health,选择Edit

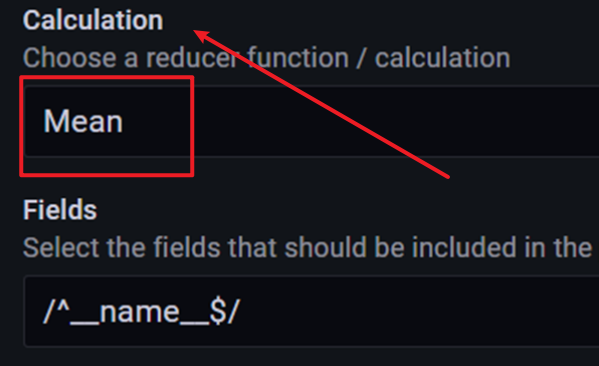
鼠标移动到右测,修改下拉框内的值

改为如下图所示,然后点击,apply,save保存模板

配置prometheusrule
创建es-rule.yaml
因为我es节点就2个,所以注释了部分告警规则
apiVersion: monitoring.coreos.com/v1
kind: PrometheusRule
metadata:
  labels:
    prometheus: k8s
    role: alert-rules
  name: es-rules
  namespace: monitoring
spec:
  groups:
    - name: es.rules
      rules:
        - alert: ElasticsearchHeapUsageTooHigh
          expr: (elasticsearch_jvm_memory_used_bytes{area="heap"} / elasticsearch_jvm_memory_max_bytes{area="heap"}) * 100 > 90
          for: 2m
          labels:
            severity: critical
          annotations:
            summary: Elasticsearch Heap Usage Too High (instance {{ $labels.instance }})
            description: "The heap usage is over 90%\n  VALUE = {{ $value }}\n  LABELS = {{ $labels }}"
        - alert: ElasticsearchHeapUsageWarning
          expr: (elasticsearch_jvm_memory_used_bytes{area="heap"} / elasticsearch_jvm_memory_max_bytes{area="heap"}) * 100 > 80
          for: 2m
          labels:
            severity: warning
          annotations:
            summary: Elasticsearch Heap Usage warning (instance {{ $labels.instance }})
            description: "The heap usage is over 80%\n  VALUE = {{ $value }}\n  LABELS = {{ $labels }}"
        - alert: ElasticsearchDiskOutOfSpace
          expr: elasticsearch_filesystem_data_available_bytes / elasticsearch_filesystem_data_size_bytes * 100 < 10
          for: 0m
          labels:
            severity: critical
          annotations:
            summary: Elasticsearch disk out of space (instance {{ $labels.instance }})
            description: "The disk usage is over 90%\n  VALUE = {{ $value }}\n  LABELS = {{ $labels }}"
        - alert: ElasticsearchDiskSpaceLow
          expr: elasticsearch_filesystem_data_available_bytes / elasticsearch_filesystem_data_size_bytes * 100 < 20
          for: 2m
          labels:
            severity: warning
          annotations:
            summary: Elasticsearch disk space low (instance {{ $labels.instance }})
            description: "The disk usage is over 80%\n  VALUE = {{ $value }}\n  LABELS = {{ $labels }}"
        - alert: ElasticsearchClusterRed
          expr: elasticsearch_cluster_health_status{color="red"} == 1
          for: 0m
          labels:
            severity: critical
          annotations:
            summary: Elasticsearch Cluster Red (instance {{ $labels.instance }})
            description: "Elastic Cluster Red status\n  VALUE = {{ $value }}\n  LABELS = {{ $labels }}"
        - alert: ElasticsearchClusterYellow
          expr: elasticsearch_cluster_health_status{color="yellow"} == 1
          for: 0m
          labels:
            severity: warning
          annotations:
            summary: Elasticsearch Cluster Yellow (instance {{ $labels.instance }})
            description: "Elastic Cluster Yellow status\n  VALUE = {{ $value }}\n  LABELS = {{ $labels }}"
#        - alert: ElasticsearchHealthyNodes
#          expr: elasticsearch_cluster_health_number_of_nodes < 3
#          for: 0m
#          labels:
#            severity: critical
#          annotations:
#            summary: Elasticsearch Healthy Nodes (instance {{ $labels.instance }})
#            description: "Missing node in Elasticsearch cluster\n  VALUE = {{ $value }}\n  LABELS = {{ $labels }}"
#        - alert: ElasticsearchHealthyDataNodes
#          expr: elasticsearch_cluster_health_number_of_data_nodes < 3
#          for: 0m
#          labels:
#            severity: critical
#          annotations:
#            summary: Elasticsearch Healthy Data Nodes (instance {{ $labels.instance }})
#            description: "Missing data node in Elasticsearch cluster\n  VALUE = {{ $value }}\n  LABELS = {{ $labels }}"
        - alert: ElasticsearchRelocatingShards
          expr: elasticsearch_cluster_health_relocating_shards > 0
          for: 0m
          labels:
            severity: info
          annotations:
            summary: Elasticsearch relocating shards (instance {{ $labels.instance }})
            description: "Elasticsearch is relocating shards\n  VALUE = {{ $value }}\n  LABELS = {{ $labels }}"
        - alert: ElasticsearchRelocatingShardsTooLong
          expr: elasticsearch_cluster_health_relocating_shards > 0
          for: 15m
          labels:
            severity: warning
          annotations:
            summary: Elasticsearch relocating shards too long (instance {{ $labels.instance }})
            description: "Elasticsearch has been relocating shards for 15min\n  VALUE = {{ $value }}\n  LABELS = {{ $labels }}"
        - alert: ElasticsearchInitializingShards
          expr: elasticsearch_cluster_health_initializing_shards > 0
          for: 0m
          labels:
            severity: info
          annotations:
            summary: Elasticsearch initializing shards (instance {{ $labels.instance }})
            description: "Elasticsearch is initializing shards\n  VALUE = {{ $value }}\n  LABELS = {{ $labels }}"
        - alert: ElasticsearchInitializingShardsTooLong
          expr: elasticsearch_cluster_health_initializing_shards > 3
          for: 15m
          labels:
            severity: warning
          annotations:
            summary: Elasticsearch initializing shards too long (instance {{ $labels.instance }})
            description: "Elasticsearch has been initializing shards for 15 min\n  VALUE = {{ $value }}\n  LABELS = {{ $labels }}"
        - alert: ElasticsearchUnassignedShards
          expr: elasticsearch_cluster_health_unassigned_shards > 0
          for: 0m
          labels:
            severity: critical
          annotations:
            summary: Elasticsearch unassigned shards (instance {{ $labels.instance }})
            description: "Elasticsearch has unassigned shards\n  VALUE = {{ $value }}\n  LABELS = {{ $labels }}"
        - alert: ElasticsearchPendingTasks
          expr: elasticsearch_cluster_health_number_of_pending_tasks > 0
          for: 15m
          labels:
            severity: warning
          annotations:
            summary: Elasticsearch pending tasks (instance {{ $labels.instance }})
            description: "Elasticsearch has pending tasks. Cluster works slowly.\n  VALUE = {{ $value }}\n  LABELS = {{ $labels }}"
        - alert: ElasticsearchNoNewDocuments
          expr: increase(elasticsearch_indices_docs{es_data_node="true"}[10m]) < 1
          for: 0m
          labels:
            severity: warning
          annotations:
            summary: Elasticsearch no new documents (instance {{ $labels.instance }})
            description: "No new documents for 10 min!\n  VALUE = {{ $value }}\n  LABELS = {{ $labels }} "
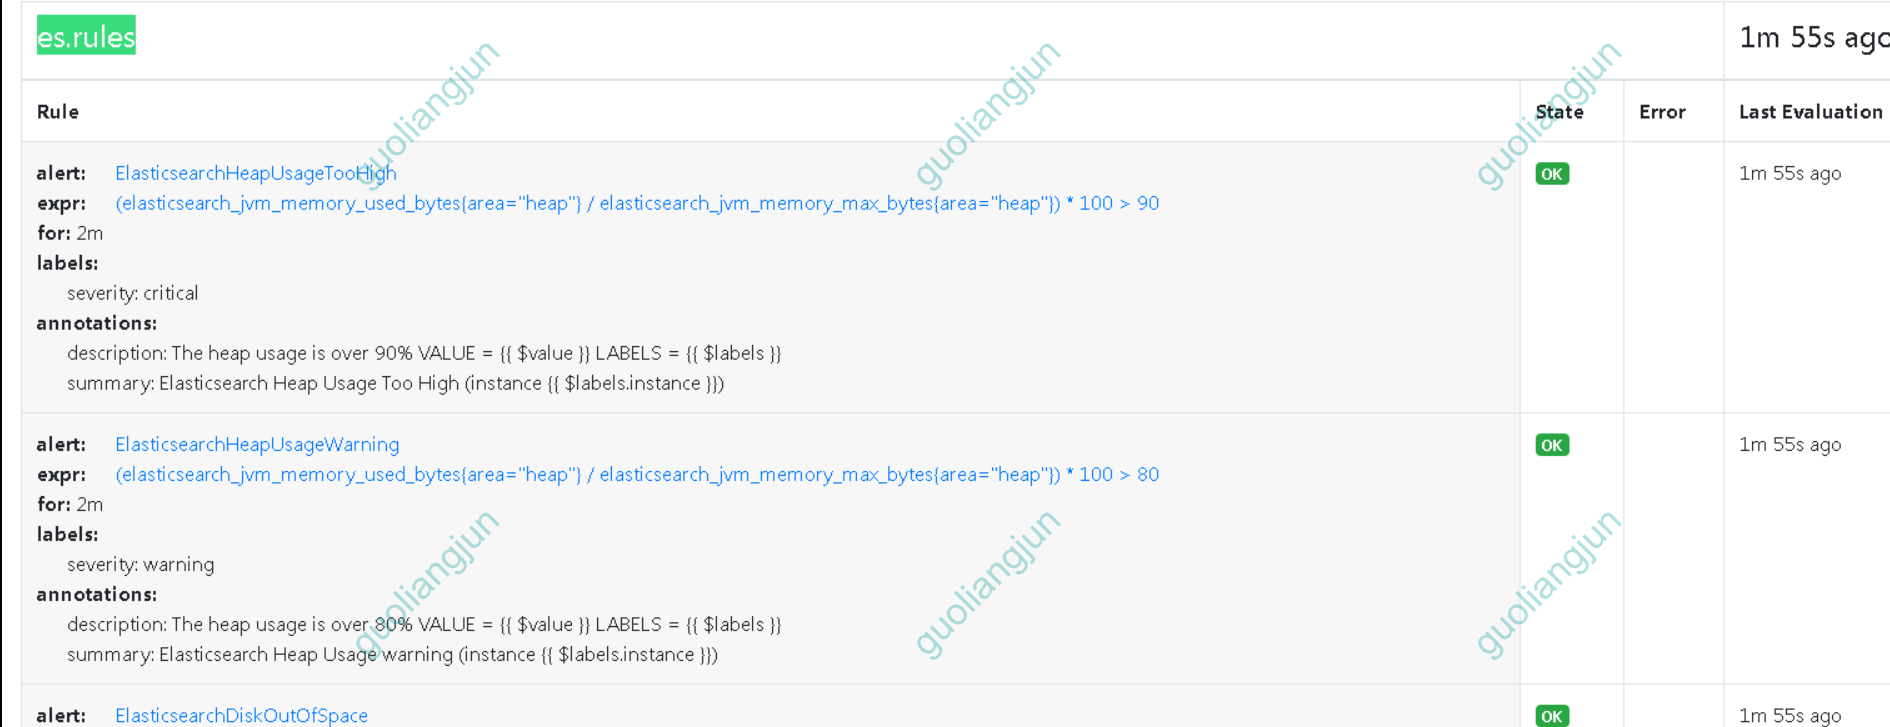
登录prometheus,查看Rules

参考:
https://github.com/prometheus-community/elasticsearch_exporter#elasticsearch-7x-security-privileges