本文最后更新于 1028 天前,其中的信息可能已经有所发展或是发生改变。
kube-prometheus监控Nacos集群
nacos配置
nacos默认是没有开启指标,需要修改application.properties配置文件,暴露metrics数据
management.endpoints.web.exposure.include=*
重启服务,可成功访问返回数据则是正常。
kube-prometheus配置
方法一:使用ServiceMonitor
集群内使用,推荐此方法。
apiVersion: monitoring.coreos.com/v1
kind: ServiceMonitor
metadata:
  labels:
    app: nacos-sm
  name: nacos-sm
  namespace: monitoring
spec:
  endpoints:
    - port: server
      interval: 30s
      path: /nacos/actuator/prometheus
  namespaceSelector:
    any: true
  selector:
    matchLabels:
      name: nacos-svc
      app: nacos
方法二:使用prometheus-additional.yaml
编辑prometheus-additional.yaml,添加
- job_name: 'nacos-cluster'
  scrape_interval: 60s
  metrics_path: '/nacos/actuator/prometheus'
  static_configs:
    - targets: ['nacos-svc.nacos.svc.cluster.local:8848']
      labels:
        instance: nacos
执行命令更新配置
kubectl delete secret additional-configs -n monitoring >/dev/null 2>&1
kubectl create secret generic additional-configs --from-file=prometheus-additional.yaml -n monitoring
检查prometheus配置是否正常
kubectl exec -it prometheus-k8s-1 -n monitoring -- promtool check config /etc/prometheus/config_out/prometheus.env.yaml
重启kube-prometheus
curl -XPOST `kubectl get svc -n monitoring prometheus-k8s|grep -v NAME |awk '{print $3}'`:9090/-/reload
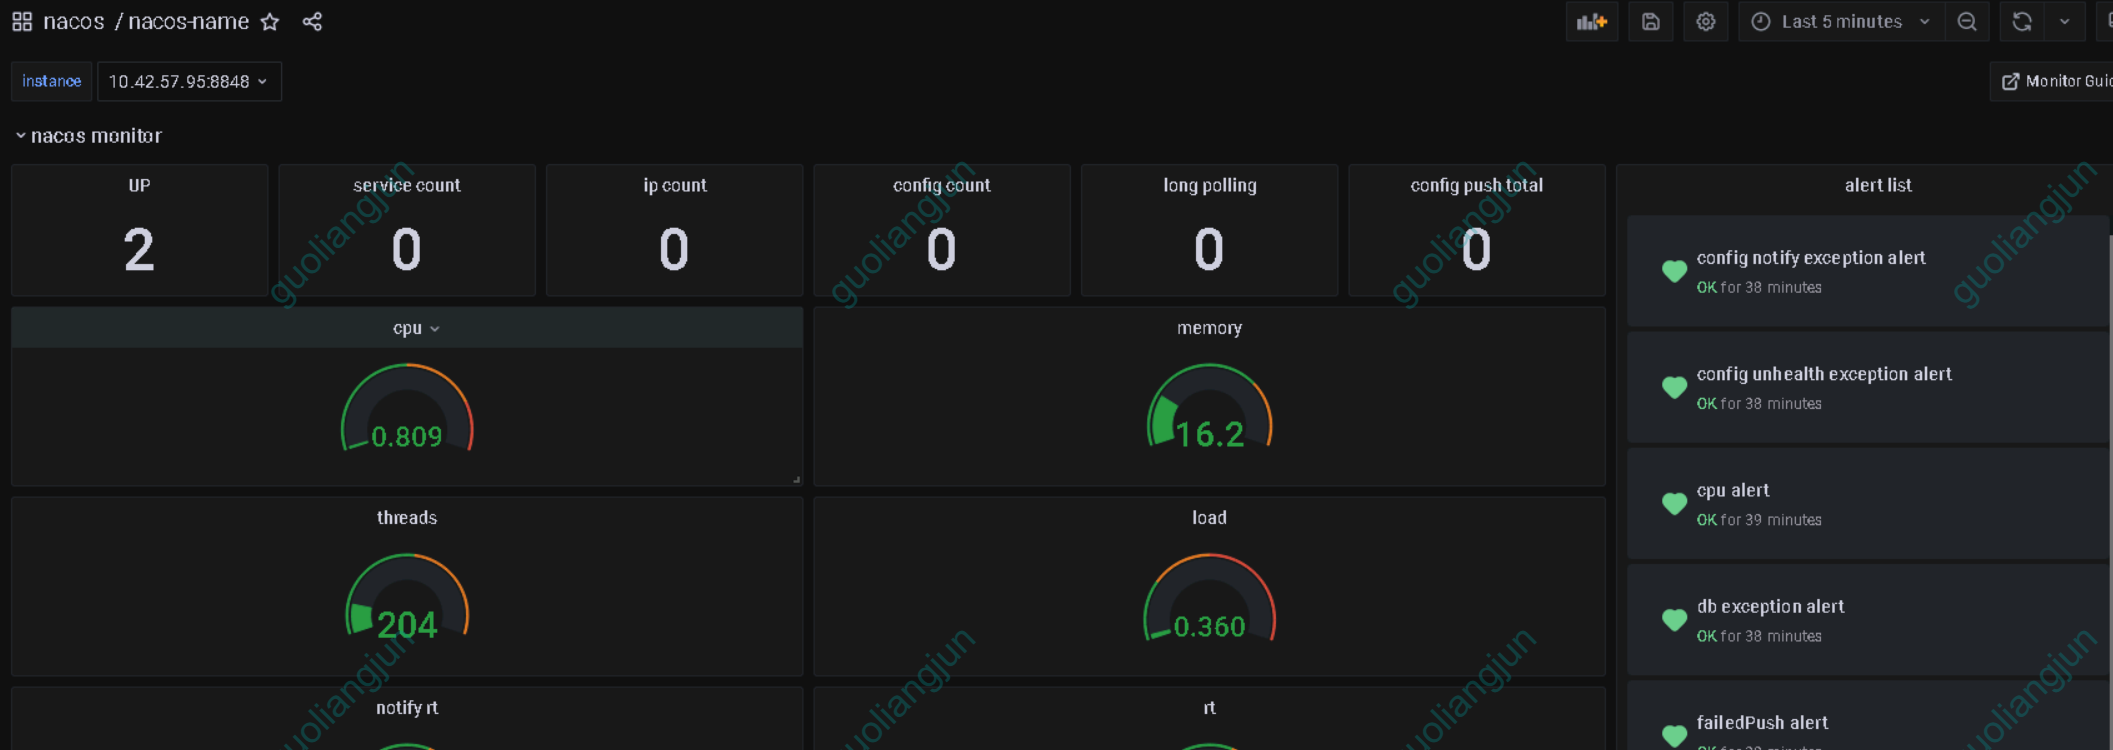
grafana配置nacos监控图表
图表地址参考:https://grafana.com/grafana/dashboards/13221-nacos/
告警规则
参考官网指标参数:https://nacos.io/zh-cn/docs/monitor-guide.html