Winlogbeat的安装与使用
前言
最新需求是需要收集windows一些安全日志和一些中间件的日志,但问了公司现有产品的公司是暂时不支持windows日志收集,于是乎安全日志打算使用Winlogbeat推送到kafka然后再进行入库消费记录。
介绍
Winlogbeat 是 Windows 事件日志的轻量级数据发送器。 虽然 Elastic 群集通常用于实时监视,但是可以对 Winlogbeat 进行调整,以手动将“冷日志”或旧的非活动 Windows 事件日志(EVTX)手动发送给 Elastic Stack。 该功能使分析人员可以从收集的系统图像中提取 EVTX文 件,并利用 Elastic 堆栈的功能进行调查。
安装
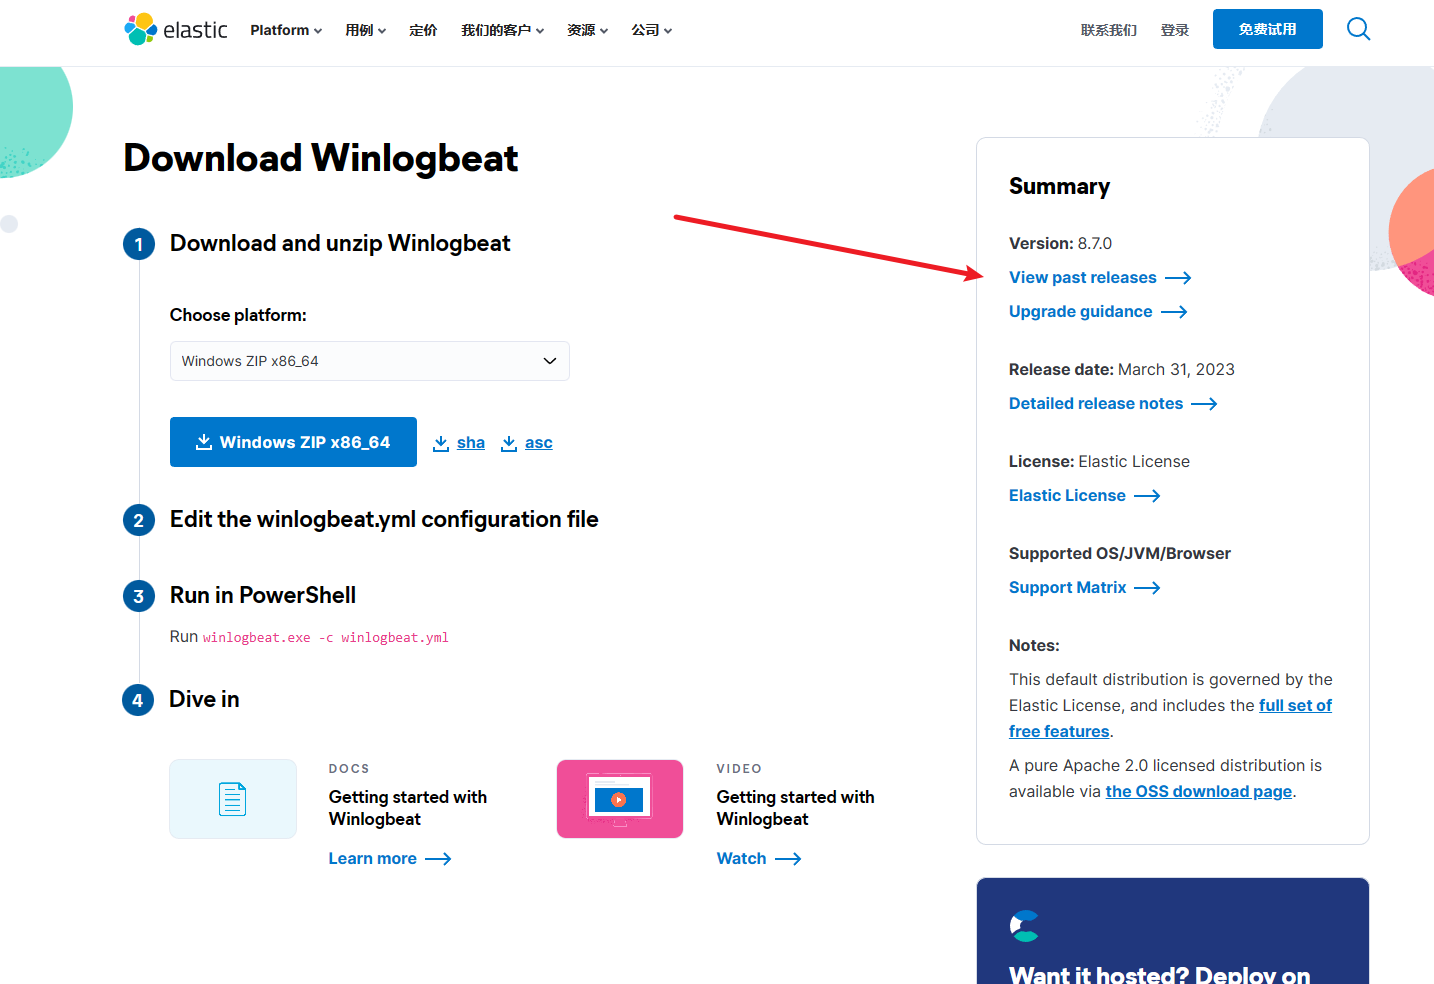
Download Link: https://www.elastic.co/downloads/beats/winlogbeat
我们可以根据自己的版本(和Elasticsearch一样的版本)来进行下载。(这里我的是7.17.9)
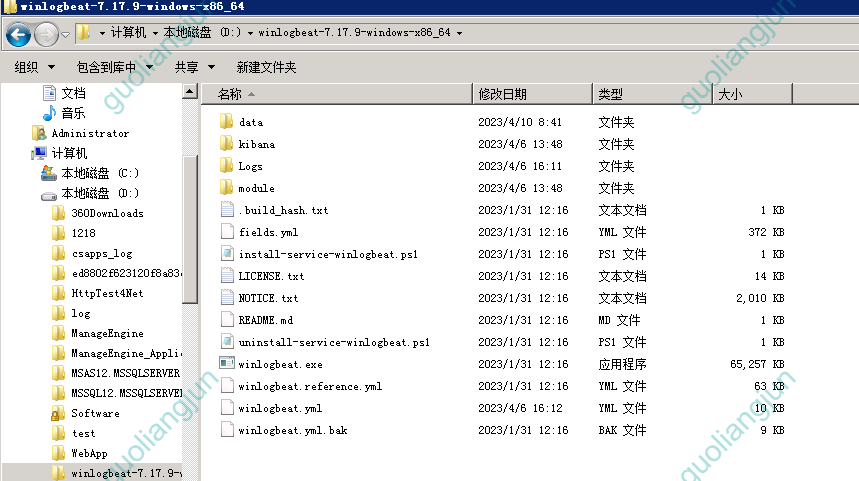
修改配置文件 winlogbeat.yml
###################### Winlogbeat Configuration Example ########################

# This file is an example configuration file highlighting only the most common
# options. The winlogbeat.reference.yml file from the same directory contains
# all the supported options with more comments. You can use it as a reference.
#
# You can find the full configuration reference here:
# https://www.elastic.co/guide/en/beats/winlogbeat/index.html

# ======================== Winlogbeat specific options =========================

# event_logs specifies a list of event logs to monitor as well as any
# accompanying options. The YAML data type of event_logs is a list of
# dictionaries.
#
# The supported keys are name, id, xml_query, tags, fields, fields_under_root,
# forwarded, ignore_older, level, event_id, provider, and include_xml.
# The xml_query key requires an id and must not be used with the name,
# ignore_older, level, event_id, or provider keys. Please visit the
# documentation for the complete details of each option.
# https://go.es.io/WinlogbeatConfig

winlogbeat.event_logs:
  - name: Application
    ignore_older: 72h

  - name: System
    ignore_older: 72h

  - name: Security
    ignore_older: 72h
    event_id: 4624-4627, 4700-4800, -4735

  - name: Microsoft-Windows-Sysmon/Operational
    ignore_older: 168h
    processors:
      - script:
          lang: javascript
          id: sysmon
          file: ${path.home}/module/sysmon/config/winlogbeat-sysmon.js

  - name: Windows PowerShell
    ignore_older: 168h
    event_id: 400, 403, 600, 800
    processors:
      - script:
          lang: javascript
          id: powershell
          file: ${path.home}/module/powershell/config/winlogbeat-powershell.js

  - name: Microsoft-Windows-PowerShell/Operational
    ignore_older: 168h
    event_id: 4103, 4104, 4105, 4106
    processors:
      - script:
          lang: javascript
          id: powershell
          file: ${path.home}/module/powershell/config/winlogbeat-powershell.js

  - name: ForwardedEvents
    ignore_older: 168h
    tags: [forwarded]
    processors:
      - script:
          when.equals.winlog.channel: Security
          lang: javascript
          id: security
          file: ${path.home}/module/security/config/winlogbeat-security.js
      - script:
          when.equals.winlog.channel: Microsoft-Windows-Sysmon/Operational
          lang: javascript
          id: sysmon
          file: ${path.home}/module/sysmon/config/winlogbeat-sysmon.js
      - script:
          when.equals.winlog.channel: Windows PowerShell
          lang: javascript
          id: powershell
          file: ${path.home}/module/powershell/config/winlogbeat-powershell.js
      - script:
          when.equals.winlog.channel: Microsoft-Windows-PowerShell/Operational
          lang: javascript
          id: powershell
          file: ${path.home}/module/powershell/config/winlogbeat-powershell.js

# ====================== Elasticsearch template settings =======================

setup.template.settings:
  index.number_of_shards: 1
  #index.codec: best_compression
  #_source.enabled: false


# ================================== General ===================================

# The name of the shipper that publishes the network data. It can be used to group
# all the transactions sent by a single shipper in the web interface.
#name:
name: 'ip_addr'
# The tags of the shipper are included in their own field with each
# transaction published.
#tags: ["service-X", "web-tier"]

# Optional fields that you can specify to add additional information to the
# output.
#fields:
#  env: staging

# ================================= Dashboards =================================
# These settings control loading the sample dashboards to the Kibana index. Loading
# the dashboards is disabled by default and can be enabled either by setting the
# options here or by using the `setup` command.
#setup.dashboards.enabled: false

# The URL from where to download the dashboards archive. By default this URL
# has a value which is computed based on the Beat name and version. For released
# versions, this URL points to the dashboard archive on the artifacts.elastic.co
# website.
#setup.dashboards.url:

# =================================== Kibana ===================================

# Starting with Beats version 6.0.0, the dashboards are loaded via the Kibana API.
# This requires a Kibana endpoint configuration.
setup.kibana:

  # Kibana Host
  # Scheme and port can be left out and will be set to the default (http and 5601)
  # In case you specify and additional path, the scheme is required: http://localhost:5601/path
  # IPv6 addresses should always be defined as: https://[2001:db8::1]:5601
  #host: "localhost:5601"

  # Kibana Space ID
  # ID of the Kibana Space into which the dashboards should be loaded. By default,
  # the Default Space will be used.
  #space.id:

# =============================== Elastic Cloud ================================

# These settings simplify using Winlogbeat with the Elastic Cloud (https://cloud.elastic.co/).

# The cloud.id setting overwrites the `output.elasticsearch.hosts` and
# `setup.kibana.host` options.
# You can find the `cloud.id` in the Elastic Cloud web UI.
#cloud.id:

# The cloud.auth setting overwrites the `output.elasticsearch.username` and
# `output.elasticsearch.password` settings. The format is `<user>:<pass>`.
#cloud.auth:

# ================================== Outputs ===================================

# Configure what output to use when sending the data collected by the beat.
# ----------------------------kafka--------------------------------------
output.kafka:
  hosts: ["10.196.69.25:9092","10.196.69.26:9092"]
  topic: 'dola_windows_log'

  required_acks: 1
  compression: gzip
  max_message_bytes: 1000000

# ---------------------------- Elasticsearch Output ----------------------------
# output.elasticsearch:
  # Array of hosts to connect to.
  # hosts: ["localhost:9200"]

  # Protocol - either `http` (default) or `https`.
  #protocol: "https"

  # Authentication credentials - either API key or username/password.
  #api_key: "id:api_key"
  #username: "elastic"
  #password: "changeme"

# ------------------------------ Logstash Output -------------------------------
#output.logstash:
  # The Logstash hosts
  #hosts: ["localhost:5044"]

  # Optional SSL. By default is off.
  # List of root certificates for HTTPS server verifications
  #ssl.certificate_authorities: ["/etc/pki/root/ca.pem"]

  # Certificate for SSL client authentication
  #ssl.certificate: "/etc/pki/client/cert.pem"

  # Client Certificate Key
  #ssl.key: "/etc/pki/client/cert.key"

# ================================= Processors =================================
processors:
  - add_host_metadata:
      when.not.contains.tags: forwarded
  - add_cloud_metadata: ~

# ================================== Logging ===================================
logging.to_files: true
logging.files:
  path: D:\winlogbeat-7.17.9-windows-x86_64\Logs
logging.level: info
# Sets log level. The default log level is info.
# Available log levels are: error, warning, info, debug
#logging.level: debug

# At debug level, you can selectively enable logging only for some components.
# To enable all selectors use ["*"]. Examples of other selectors are "beat",
# "publisher", "service".
#logging.selectors: ["*"]

# ============================= X-Pack Monitoring ==============================
# Winlogbeat can export internal metrics to a central Elasticsearch monitoring
# cluster.  This requires xpack monitoring to be enabled in Elasticsearch.  The
# reporting is disabled by default.

# Set to true to enable the monitoring reporter.
#monitoring.enabled: false

# Sets the UUID of the Elasticsearch cluster under which monitoring data for this
# Winlogbeat instance will appear in the Stack Monitoring UI. If output.elasticsearch
# is enabled, the UUID is derived from the Elasticsearch cluster referenced by output.elasticsearch.
#monitoring.cluster_uuid:

# Uncomment to send the metrics to Elasticsearch. Most settings from the
# Elasticsearch output are accepted here as well.
# Note that the settings should point to your Elasticsearch *monitoring* cluster.
# Any setting that is not set is automatically inherited from the Elasticsearch
# output configuration, so if you have the Elasticsearch output configured such
# that it is pointing to your Elasticsearch monitoring cluster, you can simply
# uncomment the following line.
#monitoring.elasticsearch:

# ============================== Instrumentation ===============================

# Instrumentation support for the winlogbeat.
#instrumentation:
    # Set to true to enable instrumentation of winlogbeat.
    #enabled: false

    # Environment in which winlogbeat is running on (eg: staging, production, etc.)
    #environment: ""

    # APM Server hosts to report instrumentation results to.
    #hosts:
    #  - http://localhost:8200

    # API Key for the APM Server(s).
    # If api_key is set then secret_token will be ignored.
    #api_key:

    # Secret token for the APM Server(s).
    #secret_token:


# ================================= Migration ==================================

# This allows to enable 6.7 migration aliases
#migration.6_to_7.enabled: true
启动
测试命令
.\winlogbeat.exe test config -c .\winlogbeat.yml -e
正式启动
.\winlogbeat.exe -e -c winlogbeat.yml
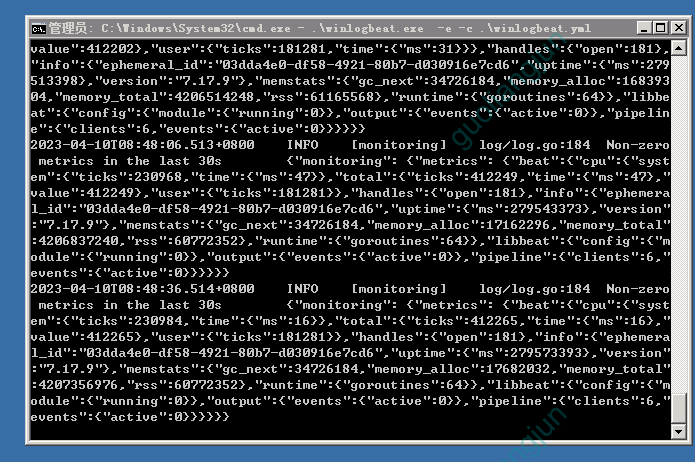
会弹出很多信息,毕竟我们 -e 参数就是把信息打印到屏幕上;
初次使用调试的时候很实用
把 winlogbeat 封装成服务启动(看需求安全是否需要)
如下图,我们可以看到文件夹里有封装成服务器的PS脚本
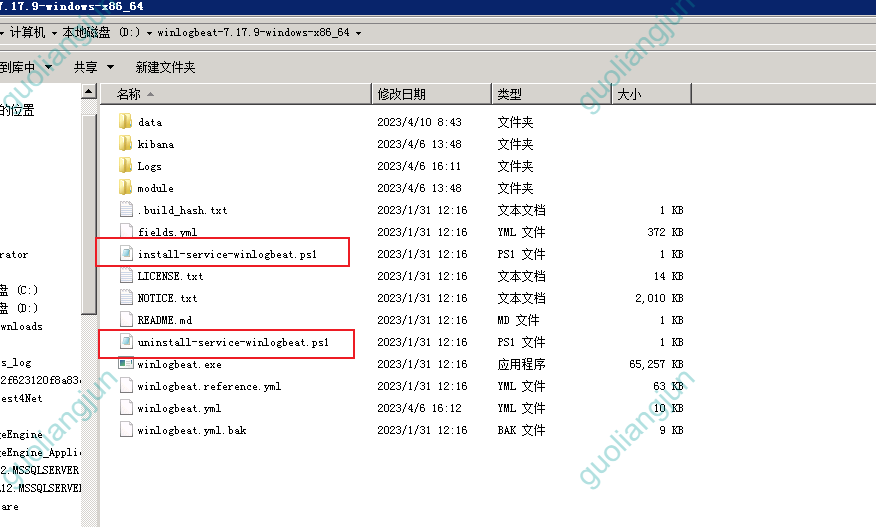
直接执行就安装
安装
.\install-service-winlogbeat.ps1
卸载
.\uninstall-service-winlogbeat.ps1
可能会提示没有权限,需要执行如下操作
Set-ExecutionPolicy -ExecutionPolicy RemoteSigned
这是powershell执行策略的问题,详情:https://learn.microsoft.com/zh-cn/previous-versions/windows/powershell-scripting/hh847748(v=wps.640)
启动服务
Start-Service winlogbeat
停止服务
Stop-Service winlogbeat
参考
- https://blog.csdn.net/UbuntuTouch/article/details/103170326
- https://www.elastic.co/guide/en/beats/winlogbeat/7.5/winlogbeat-installation.html
- https://cloud.tencent.com/document/product/614/80150
高端
公司还找人么
你要跳槽哇?